Daniel sent us an audio prompt — he's out walking with Ezra, scouting rental properties, and he's noticed something that I think anyone who's spent time in a city has felt intuitively but maybe never put into words. You walk a hundred meters off a main thoroughfare and suddenly everything changes. The noise drops, the air feels different, you're in what feels like a completely different environment. His question is basically — is that real? Are there actual measurable microclimates within neighborhoods when it comes to noise and air quality, or is it just a feeling? And he wants hard data on how steep those gradients actually are.

Oh, this is a fantastic question. And the short answer is — it's absolutely real, and the gradients are steeper than most people would guess. But the fascinating part is why, and what that means for how we should think about cities.
Before you dive into the numbers — I want to flag something he said that I think is the real insight here. He's dropping pins on Google Maps when he finds these little enclaves. He's essentially building a personal geography of micro-environments that don't show up in any real estate listing. The neighborhood is the wrong unit of analysis.
And this is something urban researchers have been saying for at least two decades but it still hasn't filtered into how we actually search for housing. Let me start with air quality, because the data here is genuinely striking. A study out of the University of Texas at Austin did hyperlocal air quality monitoring in several American cities using mobile sensors mounted on vehicles. They found that pollution levels for black carbon and ultrafine particles could vary by a factor of five to eight within a single city block.
Factor of five to eight. So the air on one side of a building could be five times worse than the air on the other side?
On the other side of the same building, yes. Traffic emissions, especially from diesel vehicles, don't disperse evenly. They're highly concentrated at the source and drop off rapidly with distance. The steepest gradient is in the first hundred to hundred and fifty meters.
Daniel's hundred-meter intuition is basically exactly what the literature shows.
It's remarkably precise. A major study in the Netherlands measured nitrogen dioxide and particulate matter at different distances from major roadways. At the roadside, you're getting the full dose. At fifty meters, you've already seen a significant drop — something like thirty to forty percent reduction for certain pollutants. At a hundred meters, you're often down to near-background urban levels. By a hundred and fifty meters, for most pollutants, you're basically there.
Near-background urban levels. So a hundred meters is the magic number.
For many pollutants, yes. But it depends on what you're measuring. Ultrafine particles, which come directly from combustion, drop off the fastest. They're so small they actually coagulate — clumping together into larger particles — within seconds to minutes of leaving the tailpipe. You might see a fifty percent drop in the first fifty meters.
Which is good news if you're a block away, and terrible news if you're living right on the arterial road.
Daniel mentioned he's currently at one of the noisiest traffic intersections in Jerusalem. That's not just an annoyance — there's a documented health impact. The World Health Organization has guidelines that long-term exposure to traffic noise above fifty-three decibels at night is associated with cardiovascular effects. Fifty-three decibels isn't even that loud — it's like a quiet conversation.
At a busy intersection you're probably getting what, seventy-plus?
Peak traffic noise at a major urban intersection can hit eighty to eighty-five decibels. That's not just unpleasant — it's a chronic stressor. Your body doesn't habituate to noise the way you think it does. Even when you're asleep, your autonomic nervous system is still reacting to those sound peaks.
Let's talk about the noise gradient specifically.
Same pattern, and in some ways even more dramatic because sound follows the inverse square law. Every time you double your distance from a point source, the sound intensity drops by about six decibels. A roadway isn't a perfect point source — it's a line source — so the drop-off is closer to three decibels per doubling of distance. But the principle holds. Move from ten meters to a hundred meters from a busy road, and you're looking at a ten to fifteen decibel reduction.
Which perceptually is enormous. A ten decibel drop sounds roughly half as loud to the human ear.
Buildings matter enormously. A solid row of buildings between you and the source can give you an additional ten to twenty decibels of attenuation. So if you're one block back from a main road with buildings in between, you might be getting a twenty-five to thirty-five decibel reduction compared to being right on that road. That's the difference between needing to raise your voice to be heard and hearing birdsong.
That's basically the metric Daniel's looking for. The birdsong threshold.
It's not a bad metric. In urban environments, bird diversity drops significantly in high-noise areas. Some species just won't nest there. So if you hear varied bird life, you're probably in a relatively quiet pocket.
We've got two different phenomena that both create these micro-environments. The air pollution gradient, driven by dispersion physics and chemistry — pollutants diluting and transforming as they move away from the source. And the noise gradient, driven by acoustics — the inverse square law and building shielding. Both produce steep drop-offs in the first hundred to two hundred meters.
They interact in interesting ways. Street canyons — those narrow urban streets with tall buildings on both sides — they trap pollution. The air doesn't circulate well, so pollutants can actually concentrate. But those same buildings block noise. So you can have a street that's acoustically quiet but has worse air quality than a more open area.
That's a nasty trade-off. You think you've found a peaceful enclave and you're actually breathing worse air.
This is exactly why you can't just go by feel. Your senses tell you it's quiet and pleasant, but your senses can't detect nitrogen dioxide at forty parts per billion. You need data.
What data actually exists at this level? Can I look up the air quality on my specific street?
Most cities have had a handful of fixed monitoring stations — sometimes as few as one or two for an entire metropolitan area. Those give you a general picture of regional air quality, but they tell you nothing about block-level variation. The station might be in a park on the outskirts and you're living next to a bus depot.
Which makes the official air quality numbers essentially useless for someone making a decision about where to live.
Not useless, but wildly insufficient. Here's what's changed in the last few years — low-cost sensors. Companies like PurpleAir, IQAir, Clarity have deployed thousands of these globally. They're not reference-grade instruments, but they give you spatial resolution that was previously impossible.
You can access this data?
PurpleAir has a public map. You zoom in on your city and you can see individual sensors — people's backyards, balconies, schools. Each one reports real-time PM two point five concentrations. In a city with good coverage, you can literally see the gradients. A sensor a block from a highway reading twenty micrograms per cubic meter while one four blocks in is reading eight.
That's exactly the kind of ground-truthing Daniel's looking for.
There's a project called Breathe London that deployed over a hundred sensor nodes across the city specifically to capture this variation. They found that PM two point five levels in some neighborhoods were consistently double those in others just a few kilometers away. And within neighborhoods, streets with bus routes had measurably higher pollution than parallel streets without.
Double within a few kilometers, and significant variation within neighborhoods. So Daniel's pin-dropping approach is not just aesthetically motivated — there's a genuine health rationale.
And I want to talk about something that doesn't get enough attention — the vertical dimension. If you're in an apartment building, what floor you're on matters. Pollution concentrations can vary significantly with height, especially in street canyons.
It's not just which block, it's which floor.
Which floor, which side of the building. A courtyard-facing apartment versus a street-facing apartment in the same building can have completely different noise and air quality profiles. A study in Barcelona found that courtyard-facing apartments had noise levels ten to fifteen decibels lower than street-facing ones in the same building, and particulate matter concentrations were twenty to thirty percent lower.
This is making me think about how real estate listings present information. You get number of bedrooms, square footage, maybe a walk score if you're lucky. But you don't get decibel levels, you don't get PM two point five averages, you don't get any of the environmental quality data that actually determines whether you'll enjoy living there.
The walk score is a perfect example of how incomplete our metrics are. It tells you proximity to amenities, which is useful, but it doesn't tell you anything about what the walk to those amenities is actually like. Are you walking along a six-lane arterial breathing diesel exhaust, or through quiet tree-lined streets?
Daniel's basically inventing a new metric. The enclave score. How quickly can you get from your front door to a place where you'd actually want to be?
That's what I find so compelling. He's not just looking at the apartment — he's looking at the network of pleasant spaces around it. The walkable radius that doesn't involve being on a major road. That's a fundamentally different way of evaluating urban space.
Let me push on something. We've established that the hundred-meter gradient is real for both noise and air pollution. But how much does it actually matter for health outcomes? Is this a marginal improvement or a meaningful one?
It's meaningful. A large longitudinal study in Canada looked at several hundred thousand people in Ontario and tracked their proximity to major roadways against health outcomes. Living within fifty meters of a major road was associated with a seven to ten percent increase in cardiovascular mortality compared to living more than a hundred and fifty meters away. For respiratory conditions, similar patterns.
Seven to ten percent is not marginal.
That's just mortality — the morbidity effects, the quality of life effects, are harder to quantify but probably larger. Asthma exacerbations, sleep disruption from noise, cognitive effects. There's a growing body of evidence that chronic noise exposure affects children's reading comprehension and cognitive development. Schools near airports or major highways consistently show lower test scores when you control for other factors.
The cognitive effects of noise are something I don't think people take seriously enough. We treat noise as an annoyance rather than a health hazard.
Because it's invisible and the effects are cumulative. You don't drop dead from noise exposure the way you might from an asthma attack triggered by pollution. But the epidemiological evidence is very strong. The European Environment Agency estimates that long-term exposure to environmental noise contributes to about twelve thousand premature deaths per year in Europe, and roughly forty-eight thousand new cases of ischemic heart disease.
Twelve thousand premature deaths from noise alone. That's a public health crisis that gets almost no attention.
Because it's distributed. Everyone's exposed to some degree, and the people most affected tend to be lower-income residents who live near highways and industrial areas. It's the kind of problem that's easy to ignore if you're not the one living with it.
When Daniel's dropping pins on quiet streets, he's not just being picky. He's doing a kind of DIY environmental health assessment.
And I want to give him credit for something else — he's doing this on foot. You cannot assess these gradients from a car. You can't even really assess them from a bike. You need to be walking, stopping, listening, smelling. The embodied experience of moving through space at three kilometers an hour gives you information that no dataset can fully capture.
Although I'd argue you want both. The walking gives you the qualitative feel, but the sensor data gives you the things you can't sense. Carbon monoxide is odorless. Fine particulates are invisible. You can walk down a street thinking the air is lovely and be wrong.
You absolutely can. Which is why I'd recommend anyone doing what Daniel's doing to cross-reference with sensor data if it's available. And if it's not, you can still do some basic heuristics. Distance from major roads is the single biggest predictor. Prevailing wind direction matters — if you're downwind of a highway or industrial area, your pollution exposure will be higher even at the same distance. Tree cover helps — vegetation can reduce particulate matter by ten to twenty-five percent in the immediate vicinity.
Tree cover as a particulate filter — that's one of those things that sounds like folk wisdom but actually has solid evidence behind it.
Leaves capture particles, rain washes them to the ground. It's not a substitute for distance from the source, but it's a meaningful supplementary effect. A study in London found that streets with dense tree canopies had PM two point five levels about fifteen percent lower than comparable streets without trees.
Daniel's ideal micro-environment — a quiet street one or two blocks from commercial areas, with some tree cover, not directly downwind of a major pollution source — that's not just aesthetically pleasing, it's measurably healthier.
The commercial proximity he mentioned is important. He wants to be one or two blocks from streets and businesses without being right on top of them. That's the sweet spot. You get walkability without the noise and air quality penalty of being on the commercial strip itself.
There's a term for this in urban planning, isn't there? The "urban village" concept?
Urban planners talk about "filtered permeability" — the idea that neighborhoods should be connected for pedestrians and cyclists but less connected for cars. So you can walk easily to amenities through routes that don't expose you to heavy traffic. The classic example is the Dutch "woonerf" — shared streets where cars are guests and pedestrians have priority.
Most cities aren't designed that way. Most cities have a hierarchical street system where arterials feed into collectors feed into local streets. And the arterials concentrate all the traffic — and all the noise and pollution.
That hierarchical design creates exactly the kind of micro-environments Daniel's noticing. The local streets are quiet because they're designed to carry almost no through traffic. The arterials are hellish because they're designed to carry everything. The contrast is built into the street network itself.
The city isn't a uniform pollution field. It's a patchwork of high-exposure corridors and low-exposure pockets, and the pattern is largely determined by the street hierarchy.
Here's something that doesn't get enough attention — the gradients within those pockets. Even on a quiet local street, the houses at the end closest to the arterial will have measurably higher exposure than the houses at the far end. We're talking about differences of fifty to a hundred meters making a detectable difference.
Which means two apartments that look identical on paper — same street, same building type, same price — could have meaningfully different environmental quality based on which end of the block they're on.
Nobody's disclosing this. The real estate market hasn't priced it in properly because the data hasn't been widely available. Some studies have tried to quantify the property value impact — in the US, homes in quieter areas with better air quality command a premium of five to fifteen percent when you control for other factors. But that's an average, and it varies enormously by market.
I wonder if that changes as sensor data becomes more accessible. If suddenly every real estate listing has an air quality score and a noise score, does that get priced in immediately?
It probably does, and that raises some uncomfortable equity questions. If clean air and quiet become amenities that are explicitly valued and priced, you potentially accelerate the pattern where lower-income residents get pushed to the noisy, polluted corridors. Which is already the pattern — it just becomes more transparent and potentially more efficient at sorting.
The market prices what it can measure. Right now it can't measure this very well, so it doesn't price it. As soon as it can measure it, the enclaves Daniel's finding — those quiet, clean pockets — they become premium real estate.
They already are, in a sense. They're just not explicitly labeled as such. The person who spends time walking around and dropping pins has an information advantage over the person who just looks at listings online. But that advantage shrinks as the data becomes more public.
Let's talk about what someone in Daniel's position should actually do with this information. He's out there walking, dropping pins, building his personal map. What else should he be looking for?
A few things. First, time of day matters enormously for both noise and air quality. That intersection he's living at now — he said it seemed quiet during the viewing. Traffic patterns have diurnal cycles. You need to visit at different times — rush hour, evening, weekend, night. An apartment that seems peaceful at two PM on a Tuesday might be unbearable at eight AM on a weekday.
The classic mistake. You view the apartment at the quietest possible time and then discover you live on a de facto truck route.
Every bad apartment I ever rented had a moment during the viewing where something felt off but I rationalized it away. There was a faint hum from somewhere, or the windows seemed unusually thick, or the previous tenant had heavy curtains in a room that should have been bright. Your brain wants the apartment to work out, so it ignores the warning signs.
That's a remarkably honest self-assessment from someone who spent decades diagnosing children's ailments by noticing exactly those kinds of subtle signals.
Diagnosing other people's problems is always easier than diagnosing your own. But for Daniel specifically — he should also pay attention to elevation. Jerusalem is a hilly city. Valleys and low points can trap pollution, especially on cold, still nights when there's a temperature inversion. You get this pooling effect where cold air — and the pollutants in it — sinks into low-lying areas.
A quiet street in a valley might have worse air than a slightly noisier street on a ridge.
These are all trade-offs. There's no perfect location — you're optimizing across multiple variables, and some of them conflict. The walkable commercial street has noise. The quiet residential enclave might have worse air circulation. The hilltop with great breezes might be exposed to regional pollution transport from kilometers away.
It's a multi-objective optimization problem with incomplete information. Which is basically life.
You can be systematic about it. I'd suggest a checklist. Visit at three different times of day. Check the prevailing wind direction relative to major roads. Look at the tree cover. Check sensor data if available. Walk the route to the nearest grocery store and count how many lanes of traffic you have to cross. Listen for the dominant sound — is it birds, or is it engines?
The engine-to-birdsong ratio. That should be a standard real estate metric.
I'm only half joking. Soundscape ecology is a real field. Researchers classify urban soundscapes into biophony — animal sounds — anthrophony — human-generated sounds — and geophony — wind and water. The ratio of biophony to anthrophony is actually a pretty good proxy for environmental quality.
You can measure that with a smartphone app now, presumably.
But honestly, your ears are pretty good instruments if you actually pay attention. The problem is that most of us have learned to tune out urban noise. We stop hearing the traffic, the HVAC units, the construction. It takes conscious effort to notice what you're actually hearing.
This connects to something Daniel mentioned — the idea that cities are full of these enclaves, you just don't know their names or where they are on a map. They're not official neighborhoods. They're emergent patterns that only become visible when you walk through the city attentively.
They're often the best places to live precisely because they're not on the map. They haven't been discovered and priced up yet. Every city has them — those little pockets that feel like villages, where the street network somehow contrives to keep through traffic out, where the buildings are oriented around courtyards or gardens, where there's a microclimate of calm.
Daniel's pin-dropping is essentially a personal discovery process for these unmapped territories.
It is, and I think there's something valuable about doing it yourself rather than relying on someone else's neighborhood guide or "best places to live" listicle. Your tolerance for noise, your sensitivity to air quality, your preference for proximity versus peace — these are personal. The perfect enclave for Daniel might be someone else's boring backwater.
Alright, let's get concrete. What are the actual numbers we should have in our heads? If I'm standing on a major urban arterial, what's the typical noise level, and what does it drop to a hundred meters back?
A major urban arterial during peak traffic — you're typically looking at seventy to eighty decibels at the curb. Continuous exposure at that level is stressful. A hundred meters back, with some building shielding, you might be down to forty-five to fifty-five decibels. That's the difference between "I need to raise my voice to be heard on the sidewalk" and "I can hear leaves rustling.
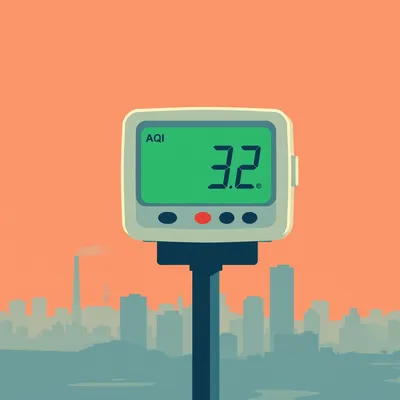
For air quality — what are we measuring and what are the numbers?
The most commonly measured pollutant that shows strong spatial gradients is PM two point five — fine particulate matter. On a busy urban road, you might see concentrations of twenty to thirty micrograms per cubic meter as an annual average. A hundred meters away on a quiet residential street, that might drop to eight to twelve. The WHO guideline is five micrograms per cubic meter annual average — almost no urban location actually meets that, but the gradient is what matters for relative risk.
You're going from four to six times the guideline to maybe twice the guideline. Still not pristine, but substantially better.
For nitrogen dioxide, a good marker of traffic pollution specifically, you see similar patterns. At the roadside, forty to sixty parts per billion is common in cities. A hundred meters back, you might be at fifteen to twenty-five. Background urban levels rather than traffic-impacted levels.
The difference between traffic-impacted and urban background — that's the distinction that matters for someone choosing where to live.
It's the single most important distinction in urban air quality, and it's almost never communicated to the public. Air quality indices give you a single number for a whole city or region. That number is usually some kind of average that smooths out exactly the variation that matters most for exposure.
Because the monitoring stations are deliberately placed to measure regional background, not hotspots.
The regulatory monitors are sited to be representative of population exposure, which means they're often away from major roads. That's appropriate for tracking regional trends and compliance with air quality standards. But it means they systematically underestimate the exposure of people who actually live near busy roads.
Which is a lot of people. In most cities, the major roads are lined with residential buildings. That's where the density is.
There was a study in Toronto that compared official monitoring station data with mobile monitoring along major roads. The mobile measurements along arterials were consistently fifty to a hundred percent higher than the nearest fixed station.
Fifty to a hundred percent higher. So the official numbers are telling you the air is twice as clean as it actually is on the streets where people live.
In some cases, yes. And this isn't a conspiracy — it's just a limitation of sparse monitoring networks. You can't capture block-level variation with a handful of stations. Which is why the low-cost sensor revolution is so important. It's filling in the gaps.
I want to circle back to something Daniel said that I think is worth highlighting. He mentioned that during the viewing of his current place, the intersection was quiet. He didn't get a sense of what it would be like during peak times. That's a systematic failure of how we view properties.
It's a systematic failure and it's completely avoidable. If you're spending hundreds of thousands of dollars on a property or signing a multi-year lease, spending a few extra hours visiting at different times is the highest-return investment you can make. But almost nobody does it systematically.
Because the viewing is scheduled for when it's convenient for the agent, not for when it's informative for the renter or buyer.
Because the housing market in most cities is tight enough that you feel pressure to decide quickly. If you hesitate, someone else takes it. So you rationalize away the warning signs.
Daniel's approach — walking the neighborhood extensively, dropping pins, building a personal map before he even gets to the viewing stage — that's a way of front-loading the information gathering so you're not making a pressured decision based on a single twenty-minute visit.
It's smart. And I'd add one more thing — talk to people who live there. Not just the agent, not just the landlord. Go to the corner store, the cafe, the park. Ask people what they like and don't like about living there. You'll get information that no dataset and no viewing will give you. Which streets flood when it rains. Which neighbors have loud parties. Where the rats come from.
The rat-sourcing strategy.
It's the oldest form of due diligence and it's still one of the best.
Alright, let's zoom out for a moment. We've established that micro-environments are real, measurable, and consequential for health. What does this mean for how cities should be designed?
It means we should stop concentrating traffic on arterials and then pretending the adjacent residential streets are fine. The hierarchical street model creates these extreme gradients — quiet enclaves and noise canyons — that are basically an accident of traffic engineering. A better model is to distribute traffic more evenly across the network, at lower speeds, so you don't have these extreme hotspots.
The "slow streets" movement basically.
Slow streets, shared streets, filtered permeability — the core idea is the same. Cars can go everywhere, but not fast, and not in volumes that dominate the street. The street becomes a public space that accommodates cars rather than a car corridor that tolerates pedestrians.
Which would flatten these gradients. You wouldn't have the extreme variation Daniel's noticing because you wouldn't have the extreme concentration of traffic on a few roads.
The gradients exist because we've engineered them into existence. They're not a natural feature of cities — they're a design choice.
In the meantime, the people who figure out how to navigate those gradients — the ones who find the quiet pockets — they're essentially arbitraging a market inefficiency. They're getting better environmental quality without paying the premium that would attach if the information were widely available.
Which is exactly what Daniel's doing with his pin-dropping. He's doing primary research that the market hasn't done for him.
There's something almost entrepreneurial about it. He's identifying undervalued assets — in this case, streets rather than companies — using on-the-ground research that most people don't bother with.
The lean startup approach to apartment hunting. Customer discovery through walking.
I'd read that blog post.
I think the broader lesson here is that the city is legible if you pay attention. The data's there — in the soundscape, in the air, in the way people use the streets, in the tree cover, in the building orientations. You just have to learn to read it.
Cross-reference with sensor data where available.
The combination of embodied observation and quantitative measurement is more powerful than either alone. Your ears tell you it's quiet — the decibel meter tells you how quiet. Your nose tells you the air smells clean — the PM two point five sensor tells you whether it actually is.
Daniel also mentioned he's doing this with Ezra in tow, which I think adds an interesting dimension. You experience a street differently when you're pushing a stroller. You notice sidewalk quality, curb cuts, shade coverage. Things that are minor annoyances for an able-bodied adult become significant barriers with a small child.
The "walkability" of a neighborhood is not a universal property — it depends on who's walking. A street that's perfectly walkable for me might be impossible for someone with a stroller or a wheelchair or a walking frame. The micro-environment includes the infrastructure, not just the sensory environment.
Ezra at ten months is presumably making his own contributions to the soundscape during these walks.
I'm sure he's providing excellent real-time audio feedback on the acoustic properties of various streets. Babies are basically mobile decibel sources.
Uncalibrated ones, unfortunately. Not scientifically useful.
Highly variable output levels. Poor signal-to-noise ratio in the literal sense.
Alright, let's pull this together. The prompt asked whether the feeling of significantly different micro-environments within neighborhoods is real, whether there's data on sound and air pollution gradients down to the street level, and essentially whether the hundred-meter intuition holds up.
It absolutely holds up. The gradients are real, they're steep, they're measurable, and they matter for health. Distance from major roads is the single most important variable for both noise and air pollution exposure in urban environments. The first hundred to hundred and fifty meters sees the most dramatic improvements. Building shielding, tree cover, elevation, and wind direction all modulate the effect. Low-cost sensor networks are making this variation increasingly visible. And the real estate market hasn't fully priced it in yet, which means attentive walkers have an information advantage.
The city is not a uniform field. It's a patchwork of micro-environments, and the boundaries between them are sharper than most people realize. A hundred meters can make the difference between chronic stress and genuine tranquility.
Between breathing air that's actively damaging your cardiovascular system and air that's merely not great.
The optimist in me says this is good news. It means small changes in where you live can produce large improvements in environmental quality. You don't have to move to the countryside — you might just have to move three blocks.
The pessimist in me says that most people don't have the luxury of optimizing at this level. They live where they can afford, and the affordable housing stock tends to be on the noisy, polluted corridors. The micro-environments we're describing are often inaccessible to the people who would benefit most from them.
That's a fair point. The enclave premium is real, even if it's not yet explicitly labeled as an environmental quality premium. The quiet, clean, tree-lined streets were never cheap.
Making the data more visible could cut both ways. If everyone can see the air quality and noise maps, it might create political pressure to clean up the bad areas rather than just letting the market sort people into clean and dirty zones.
Sunlight as disinfectant, applied to urban planning.
The more visible these gradients become, the harder it is to ignore the fact that we've concentrated environmental harms on the streets where lower-income people live.
That's a good place to leave it, I think. The data confirms the intuition, the gradients are real, and making them visible is both an individual tool for better decision-making and a collective tool for demanding better urban design.
Daniel should keep dropping those pins.
Now: Hilbert's daily fun fact.
Hilbert: In the nineteen forties, a British explorer in Tibet discovered a single surviving palm-leaf manuscript containing a bilingual text — part logographic, part phonetic — that became the only known key to deciphering a previously unattested script now called Nam, which appears to have been used for ritual record-keeping by a small Buddhist sect that died out in the seventeenth century.
...right.
This has been My Weird Prompts. Thanks to our producer Hilbert Flumingtop for the fact and the production. You can find us at myweirdprompts dot com or wherever you get your podcasts. If you enjoyed this episode, leave us a review — it helps other people find the show.
Until next time.

")